
- Arguably the product or service offered is the most critical component of the marketing mix. For most companies, each product or service in its product portfolio has its own cycle of growth, and can be managed to maximize profit by prioritizing the marketing spend. For example, for food group Mars, its best-selling namesake chocolate bar has been a longstanding source of profits, funding the corporation’s expansion into other areas, such as ice cream and pet food.To help decisions about diversifying into such new markets, companies can use various tools:
a., Ansoff’s Matrix, which plots existing and potential products or services according to the risk factors involved. If a business decides to develop and market something new, how it presents the offering and gets the message to consumers is an important consideration.
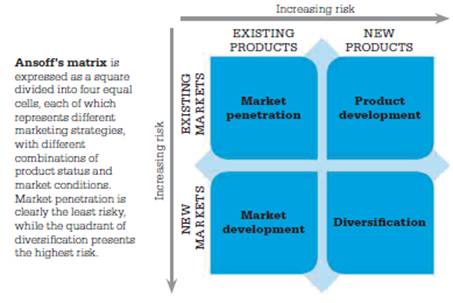
First published in 1957 in the Harvard Business Review, Ansoff’s matrix is a marketing tool for planning the strategic growth of an organization. Created by mathematician Igor Ansoff, it is intended for businesses that are ready to expand and have the resources to fund growth. The matrix offers four possible strategies that a company might adopt, depending on the status of its product and the conditions of the market: market penetration, market development, product development, and diversification. In addition to presenting these four strategic options, the matrix also attaches an inherent risk factor to each one. It is crucial for decision makers to take the risk factor into consideration, lest it gamble too heavily with the company’s existing resources. Each approach is differentiated by whether products or services are unchanged or new, and whether they remain in the existing market or are entering a new one.
- The least risky of the four strategies is “market penetration”—maximizing sales of an existing product in an existing market. In this approach, greater sales might be achieved through competitive pricing, advertising, loyalty programs, or by driving out competitors.
- “Market development” entails selling the same product in different markets. Additional spending may be unnecessary unless localization is required, but the cost of setting up distribution channels in the new market poses some risk. In this model, different geographic or demographic markets, or alternative sales channels—such as online or direct—might be tapped.
- “Product development” strategy is the sale of new or significantly improved products to an existing market. Here, the cost of product development, associated distribution, and marketing support poses a risk. Companies adopting this strategy might offer variants of the product, or develop related goods.
- The final, and riskiest strategy, is that of “diversification”—moving into new product areas and new markets. This strategy reduces risk in the long term by alleviating a company’s reliance on core products. However, a company can risk a great deal, depending on the initial outlay, and needs to have plenty of resources if the strategy fails.
In the 1970s Ansoff recognized the problem of “paralysis by analysis”—the overthinking of a problem and subsequent failure to act. He advocated a more flexible approach, based on local conditions and a company’s individual cirumstances. Ansoff’s matrix has limitations. Because it focuses on market potential and strategies for growth, it is not able to support other factors and scenarios, such as the resources available, or if a company’s priority is survival rather than growth. However, used with other marketing tools, it remains valuable and is still used to gauge actual and expected growth.
- Case study: Tesco: UK supermarket Tesco’s venture into the US shows the risks of diversification. After 10 years’ preparation, it launched its Fresh & Easy stores in 2007, but misread the market. Positioning itself in the middle, it was neither upscale nor discount, with most of its outlets in working-class suburbs where consumers looked for bargains. Critically, Tesco’s small-scale, walk-in stores did not suit the average car-dependent US shopper. The investment did not pay off, costing Tesco over $1.9 (Ł1.2) billion. The outcome may not have been forecast by Ansoff’s matrix, but the risk would have been clear.
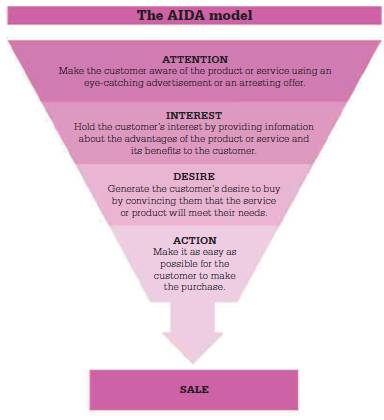
b., In planning a launch, another valuable tool, the AIDA Model, provides clear-cut criteria for defining the features of any new product or service: how it grabs consumers’ attention, holds their interest, generates desire, and is perceived to be attractive. The advent of e-commerce prompted award-winning UK copywriter Ian Moore to suggest NEWAIDA as a more relevant model for e-marketing: AIDA preceded by navigation, ease, and wording. It seems that as markets have become more complex, marketers require ever-clearer ways of perceiving the customer journey.
c., Concurrent with developing a specific product or service for a particular market, creating a brand is equally important. The goal should be to make the brand synonymous with a set of unique product qualities. In the words of marketing expert Seth Godin: “A brand is the set of expectations, memories, stories, and relationships that, taken together, account for a consumer’s decision to choose one product or service over another. If the consumer ... doesn’t pay a premium, make a selection, or spread the word, then no brand value exists for that consumer.”
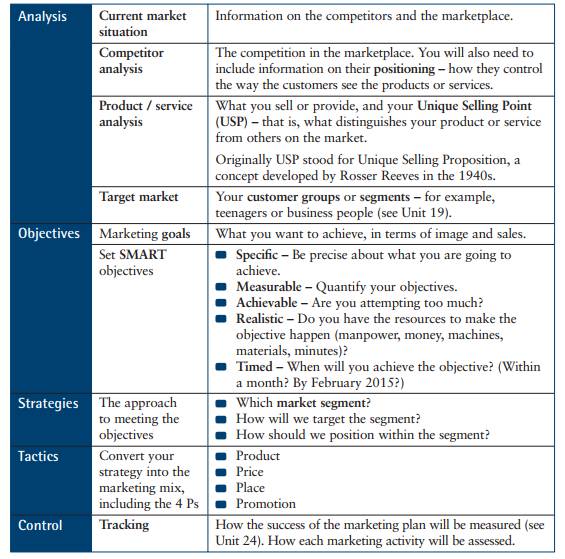
A marketing strategy includes the following:
(1) Analysis of the wider business environment. More specifically: the political / legal, economic, social / cultural, and technological factors operating in the external world. (The acronym ’PEST’ / ’STEP’ are sometimes used here)
An example:
SOCIOLOGICAL FACTORS
- Dominant religions: Mainly Christian, with significant minorities in some regions.
- Special diets in some areas.
- Leisure activities: Watching TV, cooking, socializing.
- Gender roles: Now that younger men shop as much as women, we need to target both sexes equally.
- Birth rates: Birth rates are continuing to decline, with fewer babies born every year.
- Average life expectancy: This is increasing so we should think about products for older customers.
- Attitudes to foreign products: Consumers like to experiment with foreign food and drink.
- Opinions on environmental issues: We should use only recyclable packaging and hybrid-fuel delivery vans.
TECHNOLOGICAL FACTORS
- Innovation and technological advances:
- Production: New product lines and product types are continually coming onto the market.
- Offer: We now offer a new service – ordering by mobile phone.
- Distribution: Online ordering has changed the way supermarkets operate. We no longer need actual shops.
- Communication with consumers: Broadband internet connections make it possible to include more product photos on our site. We could even think about adding video.
ECONOMIC FACTORS
- The economic forecast is good:
- Interest rates: stable at 5%
- Unemployment rate: less than 9% of people are out work
- GDP (Gross Domestic Product): growing steadily
POLITICAL FACTORS
- Political stability: Very good. Consumers feel relaxed about the political situation and ready to use consumer credit.
- New tax / business legislation: No changes to the law for our business sector in the near future.
- International trade agreements: We can import products from the EU without paying extra import duties.
- Identification and analysis of target marketers for new products
- Sales goals in terms of volume and revenue
(2) The marketing budget
a., the affordable approach: the company forecasts revenues, deducts costs, and allocates a part of the remaining funds to promotion.
b., the percentage of sales approach: a percentage of current or anticipated sales is allocated to marketing actions. Typically, ten percent of net sales is spent on promotion.
c., the objective-and-task approach: the company costs out, or calculates, the cost of reaching its marketing objectives.
d., competitive parity: competitor investment is tracked, or monitored, and used as a rule of thumb to set the promotion budget. The objective is to beat or match the investment of competitors.
(3) Elements of the marketing mix, and their timing
- Marketing plan: The company’s marketing plan is the written document which details the marketing methods selected (advertising, price promotions, etc.) and specific marketing actions or marketing activities (for example, a back-to-school promotional offer). It also examines the resources needed (both financial and human) to achieve specified marketing objectives, such as an increase in sales or a successful product launch, over a given period of time.
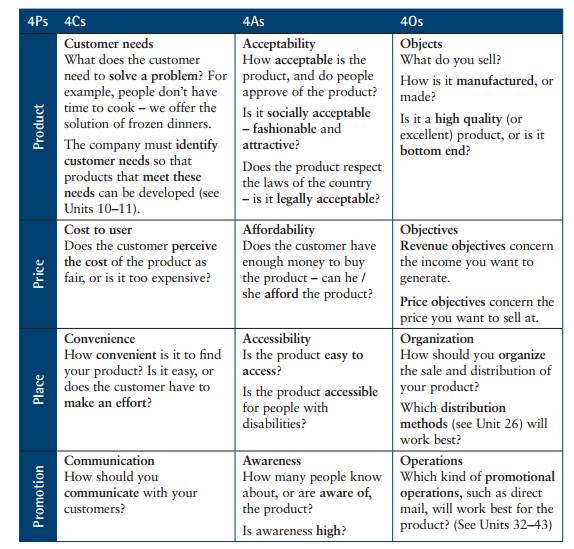
- The term ’marketing mix’ is another name for the well-known four ’P’s: product, price, place (ie distribution channel) and promotion.
Today some marketers talk about an additional four Ps:
- People: how your staff (or employees), are different from those in a competitor’s organization, and how your clients are different from your competitor’s clients.
- Physical presence: how your shop or website looks (or packaging, too)
- Process: how your product is built and delivered, or how your service is sold, delivered and accessed.
- Physical evidence: how your service becomes tangible. For example, tickets, policies and brochures create something the customers can touch and hold.
Marketers often use the term ’total product offer’ to reinforce the diversity of elements that make up a ’product’. These include value-for-money (= relationship between quality and price), brand name and image, packaging, convenience of sales channel, store surroundings, service, speed of delivery, the guarantee, etc.
- New models: Some marketers have supplemented the four Ps with new ways of thinking about marketing. The Ps, Cs, As and Os can be combined when looking at the marketing mix.
- Origin of new product ideas:
- Market research
- Pre-sales and after-sales staff listening to customers
- Customers making direct suggestions
- Competitor acticity (including attempts to ’reverse engineer’ products – finding out how they were made and then copying the process)
- The R&D department
- External changes in the market
- Key concepts:
- convenience / fast moving consumer / consumer packaged goods: products with a high turnover and relatively low price, such as table salt or shampoo
- white goods: major household electrical goods which are usually white
- brown goods: major household electrical goods that are not usually white (TV, DVD)
- perishable goods: goods that have a limited shelf life and must be consumed relatively quickly
- durable / hard goods: goods that last for a long time – they cannot be easily wornout or used up
- nondurable / soft goods: goods that are used up or last for less than three years (consumable supplies: CD ROM, ink for a printer)
- green products: products that are not harmful for the environment
- generic products: products sold without a brand name, usually in a supermarket or in a pharmacy as alternatives to brand name drugs
- healthcare products: products that are beneficial for your health and well-being – for example: vitamins, plasters
Four key factors of products:
- features: functional and psychological benefits
- branding
- packaging
- labelling
Types of services:
- childcare
- financial
- consulting
- risk management
- cleaning and maintenance
- education and training
- healthcare
- hairdressing
- telecommunications
- entertainment
- tourism
- marketing and advertising
- Product line: group of related products that are physically similar or intended for the same market
- Product mix (product range): assortment of product lines and individual offerings
- Product life cycle: introduction; growth; maturity; decline
A., BCG Matrix: In 1875, the Boston Safe Deposit and Trust Company was set up in its home port in New England to offer safekeeping services to local merchants and ship owners. Run by several generations of the prominent Bostonian family, the Lowells, the company had grown by the 20th century to become a prominent financial institution. In 1963, a chance meeting between the Boston Safe Deposit and Trust Company CEO John Lowell and one of the US’s brightest management the company. Initially finding it difficult to land clients and compete against larger consultancies, Henderson came up with the idea of offering “business strategy” as a unique service. A few years later, with a team of 36, Henderson devised the now-famous growth-share matrix (1968). His company, BCG, has since grown to become a significant global management consultancy employing more than 2,000 staff in 75 offices around the world.
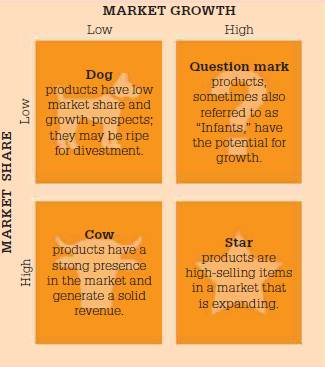
- a., Problem children are proucts or services that are not yet established, or well-known in the market. They will consume resources – for example, time or money – before giving a return on investment (ROI). In some cases, these products or services may never be profitable – make the company money – especially if they are in a slow-growing business sector or a saturated market, such as diet drinks or the mobile phone market. In the introduction stage the product is promoted to create awareness. It has low sales and will still be making a loss. If the product has few competitors, a skimming price strategy can be used (a high price for early adopters, which is then gradually lowered).
- b., Stars have both high market growth and high relative market share. These products or services are probably in a fast-growing sector. They generate high cash flow, buta re not always profitable. Profitability depends on the amount invested in the star. In the growth phase, sales are rising rapidly and profits are high. However, competitors are attracted to the market with similar offerings. The market is characterized by alliances, joint ventures and takeovers. Advertising budget are large and focus on building the brand.
- c., Cash cows have high relative market share, but little market growth. They are products or services that consumers know, trust and consume. They generate profit as they don’t need much investment. They can be used to feed research and development for other products. In the maturity phase, sales growth slows and then stabilizes. Producers attempt to differentiate products and brands are key to this. Price wars and competition occur as the market reaches saturation.
- d., Dogs are products or services that have low relative market share and low market growth. They consume resources and do not create profit. They may generate a negative cash flow – that is, they make a loss. The best course of action is to raise prices to maximize income, known as harvesting, before finally dropping the line – taking the product or service off the market. In the decline phase, there is a downturn in the market. The product is starting to look old-fashioned or consumer tastes have changed. There is intense price-cutting and many products are withdrawn from the market.
- Case study: Nestlé: Nestlé is often cited by management theorists as a textbook example of how a company might arrange its product portfolio according to the BCG matrix. The world’s largest food company, with some 8,000 brands, Nestlé has developed a strategy of building its long-term cows and keeping them as fresh as possible, devoting capital to product areas that have a prospect of high returns, and shedding products with limited potential. The coffee brand Nescafé has continued to perform well since its 1938 launch, thanks in part to the company’s strategy of investing in and expanding the range. At different times in the company’s history it has been a cow and a star product. Instant coffee is now a reliable cow, funding expansion in other areas. However, the company’s organic food range has suffered low market share in a growing market, making it a question mark. Nestlé’s large share of the food seasonings sector, a low-growth area, could be seen as a cow. Through a series of acquisitions, Nestlé has become the leading pet-food maker in a globally highgrowth market, elevating food products for real dogs and cats into star products.
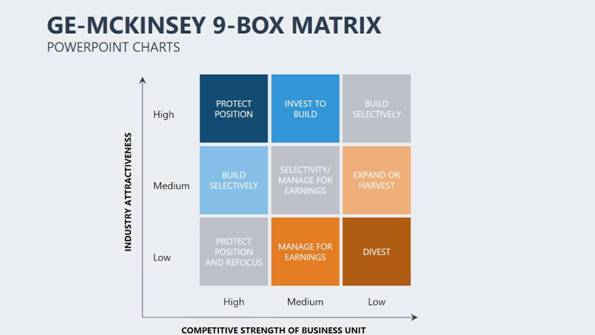
B., GE-McKinsey Matrix: Other models have evolved from the BCG. In the 1970s, General Electric consulted with business advisors McKinsey & Company to develop an alternative known as the GE– McKinsey matrix. This nine-cell model enables a more complex analysis of the product portfolio, and allows companies to plot market attractiveness and competitive strength.
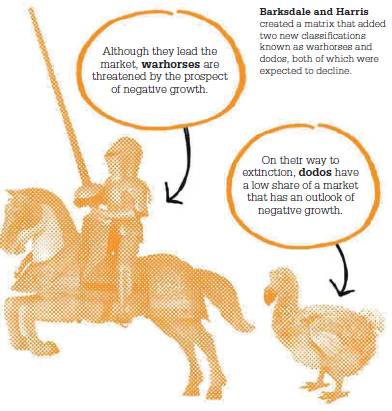
C., New BCG Matrix: In 1982, H. C. Barksdale and C. E. Harris proposed two new product classifications to add to the original BCG matrix: “warhorses” and “dodos.” Warhorses lead the market but are threatened by a negative market growth, so a business must gauge whether to ride out the storm in the belief that it will pick up, or work the horse as long as possible with minimal outlay. Dodos are about to become extinct, with low share in a negative growth market.
Tips to remember:
- Package your different service levels. Create bundles that are easily sellable and that cater to your customers’ varying needs and budgets.
- A high-end package for a car maintenance plan may include picking up the car for service and cleaning the interior.
- A low-end, prepaid package could include a reminder phone call for service and an oil change. These levels are differences in the actual delieverables and the total value.
- Combine services to create a new offering. For instance, as a marketing consultant, you could join forces with a copywrighter and a graphic designer to create a ’Business Start-up Success’ package.
![]() Exercise 1: Complete the text with the words in the box!
Exercise 1: Complete the text with the words in the box!
![]() Exercise 2: Put the letters in the right order!
Exercise 2: Put the letters in the right order!
Video 1: Syrup
- What’s the overall marketing message of Syrup?
- What do the main characters’ names stand for?
- The movie characterizes young American consumers as image-conscious and cynical. Do you think this is true in real life?
- In one line in the movie, Scat states that as long as the product tastes better than urine, consumers are going to convince themselves that they like it. Was this a dig at energy drink companies in the real world?
- Analyze the two marketing campigns of FUKK and COK!